Omniwithdrawals
 Early Payouts
 Crypto Wallets
 Advances
 Express
 vIBAN
vIBAN Music
Music Facebook distribution
 Team Finance
 Webmon
 YouTube Playables
 Viral Music
 Influencer marketing
 Affiliate program
 About Us
 Services
 Security
 Finances
 Careers
 Blog
Blog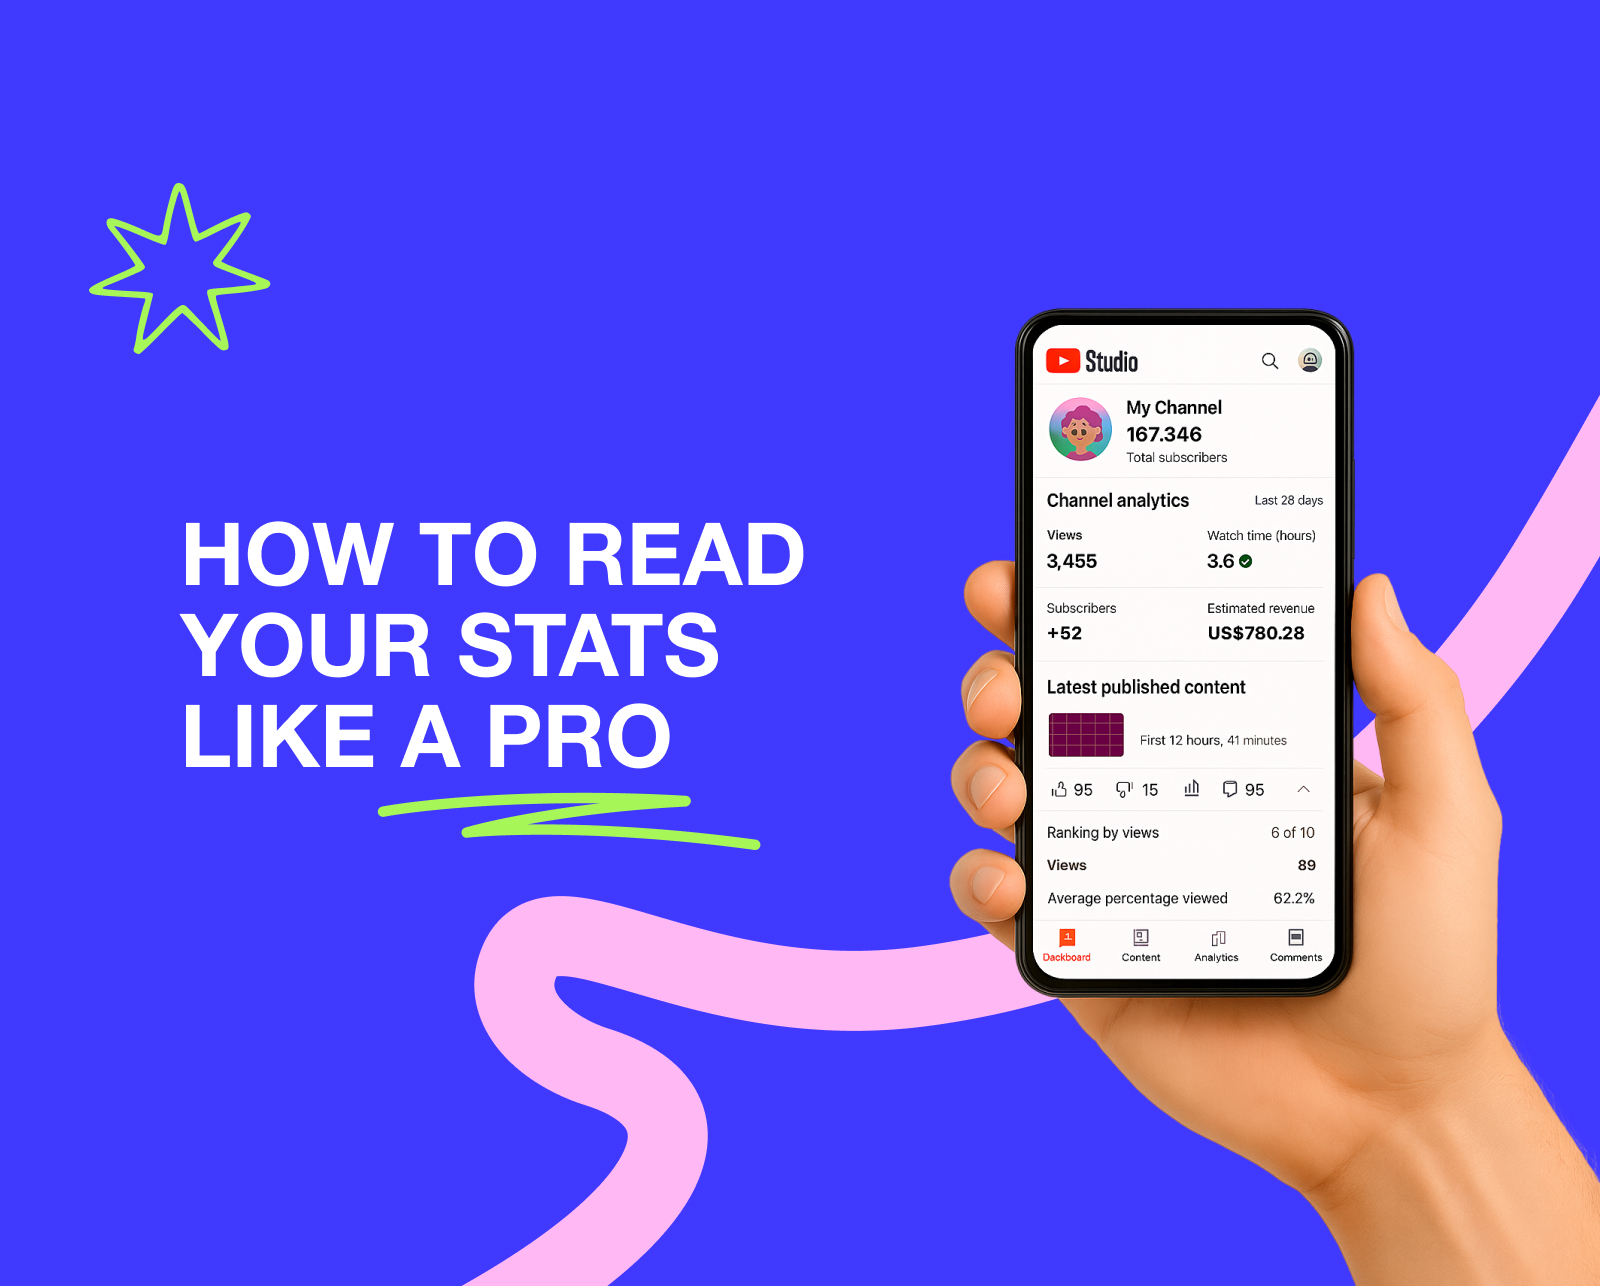
If you are a YouTuber, you definitely need to understand your channel’s metrics. YouTube Analytics is not only about numbers, charts, and metrics, but also about how your channel actually works and what results you can get from it. This will allow you to keep the situation under control and quickly adjust your content plan to algorithm changes. Need more reasons? Then read the article: here we will not only emphasize the importance of Analytics, but also share metrics and tools to optimize this challenging process.
Why Do You Need YouTube Channel Analytics?
We already hinted at this in the previous paragraph, but still: why should you keep track of views, likes, and other numbers? Isn’t that a thing of the past? It is literally the key to your success. Not convinced? We’ve put together a few obvious benefits for you, in case you decide to start working with YouTube Channel Analytics:
- Help to Optimize Growth and Attract Right Target Audience
We understand how difficult it can be at the beginning of your journey to find the right development strategy and create a compelling content plan on the first attempt. In this case, YouTube Analytics will act as a teacher, showing you the right path and pointing out videos that are not generating the desired profit. What’s more, you can also use metrics to build a profile of your target audience, which is definitely a plus.
- Understand Data and Boost It
There comes a moment for every creator when views drop and they frantically search for YouTube channel growth tips. YouTube Analytics is an excellent remedy for the channel’s ‘bad days’ in this case. It will help you understand which strategies no longer work and which videos, on the contrary, attract new viewers. Unfortunately, without Analytics, this is impossible.
- Find Winning/Losing Content
The clearer you understand your video metrics, the better you can make your content plan and ‘scrap’ videos that don’t perform well. That’s why YouTube gave every creator access to Analytics.
- Maximize Your YouTube Income
Of course, one of the reasons why we recommend keeping track of YouTube Analytics is potential income. The better you work with metrics, the more you earn for each video. This may seem obvious, but we couldn’t help but mention this important reason. If you’ve been thinking about steps to maximize RPM, Analytics is definitely a powerful tool for this important task.
How to Open YouTube Analytics
We are sure that you have already visited Analytics (more than once), but let’s make sure that we are talking about the same thing. Here’s how to log into YouTube Analytics on your computer and phone.
1. On Desktop (YouTube Studio website)
- Go to YouTube Studio.
- Sign in with your Google account (that is linked to your YouTube channel).
- Click Analytics (bar chart icon) in the left-hand menu.
Here you’ll have 4 main tabs:
- Overview (general information)
- Content (video performance & reach)
- Audience (who watched your content)
- Research (topic & keyword insights)
2. On Mobile (YouTube Studio app)
- Download the YouTube Studio app from the Google Play Store or App Store.
- Open the app and log in with your channel account.
- Tap the menu (☰) and then select Analytics.
- You’ll get 4 same tabs: Overview, Content, Audience, Research.
15 Important Metrics to Master Analytics

Before you start thinking about the best ways to monetize your YouTube channel and imagining your holiday on a tropical island, there is a lot of work you need to do. We are referring to the metrics from YouTube Analytics that are worth paying attention to. We will discuss each of them in more detail below.
1. Watch Time
What it is: The total number of minutes your videos have been viewed and the contribution of your videos to the total number of views on the channel.
What the metric influences:
- Shows the success of the video. Helps analyze which components made a video go viral based on the average viewing time.
- Points out its quality. The viewing time directly highlights the quality of the video: from the resolution to the editing and colour correction.
- Discloses traffic sources. Thanks to advanced analytics, you can also see watch time across each traffic source: from the recommendations and the Subscriptions feed.
How to increase the indicator:
- Focus on the first 30 seconds of the video. They are the ones that hold the viewer’s attention and make them watch the video until the very end. In those few seconds, it is important to convey the benefits of the video and why it is worth watching until the end.
- Create playlists. If you create an eye-catching thumbnail for your playlist, come up with a meaningful title, and group videos with the same topic together, your viewing time will quickly increase.
- Remove long pauses. To increase viewing time, viewers should not be bored. The longer the pause between your words, the more you delay with the next phrases, the less eager viewers will be to spend time on your content.
- Split the video into parts. Add timecodes, leave them in the video description and in the first 30 seconds so that the viewer immediately understands which part of the content may be most useful and interesting to them.
What metrics it can be combined with:
- Average View Duration (AVD) + Watch Time: If the first metric shows average video viewing figures and where the statistics are ‘lagging behind’, viewing time will help you understand which specific videos are unsuccessful and where viewers’ interest is waning.
- Average Percentage Viewed (APV) + Watch Time: APV shows what percentage of your audience watched a specific video, and viewing time helps you understand what is wrong with viewing duration and interest in the video.
- Audience Retention + Watch Time: The first indicator literally points to the best and most problematic moments in the video, while viewing time helps track the rise and fall of interest in the video after such fragments.
2. Target Audience
What it is: Complete profile of a viewer (age, gender, nationality, when the viewer is online, how many subscribers the channel has, native language.)
What the metric influences:
- Choice of formats. The better you understand your audience, the more clearly you can choose which video format will be most interesting. For example, young people can be hooked with short, dynamic videos, while the older generation prefers long videos with a wealth of information.
- Niches and video topics. Obviously, you need to know your audience’s metrics in order to come up with video topics. For example, an older audience will not be as interested in news from TikTok and new trends in youth brands. At the same time, young people will not be interested in following political news and other adult topics.
- Frequency of publications. The younger the audience, the faster it consumes content. Therefore, if your target audience is teenagers, your posts should be more frequent than for adults.
What metrics it can be combined with:
- Devices + Target Audience: Understanding your target audience and the devices they use to watch videos helps determine what format your content should be in and how dynamic it should be.
- Traffic Sources + Target Audience: Understanding the source of target audience traffic can help you understand which source to focus on and how to tailor content to each case.
- Views per Viewer + Target Audience: By understanding your target audience, you can influence how often viewers will rewatch your videos and watch them in series rather than individually.
3. Devices
What it is: The types of devices on which your content was viewed.
What the metric influences:
- Understanding what format to shoot (long or short videos). For mobile it’s better to use vertical videos, for TV and computer — horizontal ones.
- Usage of captions on videos. The bigger the screen is, the bigger all the captions should be.
How to increase the indicator:
For computers and TVs, you need clear video chapter divisions, high video quality, more infographics and statistics. It would also be better to focus on long videos, as there will be more advertising and revenue on TV.
For mobile devices, you need large, legible text and attractive thumbnails. In this case, it is better to focus on a short, vertical, dynamic video format.
What metrics it can be combined with:
Audience Retention + Devices: In combination with devices, you can understand how retention rates correlate with what viewers watch videos on and how content is adapted to different screen formats.
4. Average Percentage Viewed
What it is: Average percentage of a video watched among those who stayed to watch.
What the metric influences:
- Watch Time stability. This metric directly affects the total viewing time and depth. This way, your videos will be promoted more and even more people will stay on them longer.
- Frequency of your content search. The more and longer your videos are watched, the more often they will appear at the top of search results for similar topics.
How to increase the indicator:
- Add teasers at the beginning. Tell viewers right away what will be in the video. That way, they will understand what part to watch to find the answer to their question.
- Cross-promote new videos. Share links to your new video on your social media accounts to ensure you get a good number of views on your new content from the outset. This will help promote your video in recommendations.
- Test formats and monitor them in YouTube Analytics. Test different topics and video formats to get more views. But don’t forget to check your video statistics so you don’t ruin your channel’s performance and disappoint your audience.
What metrics it can be combined with:
Average View Duration (AVD)+ Average Percentage Viewed: If the first metric is responsible for the average viewing time in minutes, the second indicator shows the percentage of views for specific videos. This allows you to conduct an in-depth analysis of the content and understand its weaknesses.
CTR+ Average Percentage Viewed: Thanks to Average Percentage Viewed, you can understand how effectively your video thumbnails are working.
5. Average View Duration
What it is: The average viewing time for each video (counts in seconds/minutes).
What the metric influences:
- Watch Time stability. The better the Average View Duration, the more stable the views of subsequent videos will be.
- Understanding of suitable formats. Thanks to this metric, you can understand which formats have a negative impact on your statistics and replace them with more successful ones.
How to increase the indicator:
- Add timecodes. It will be more convenient for viewers if your videos are divided into logical sections that can be accessed with a single click. Leave timecodes in the comments or video description so that viewers can find the relevant sections in a matter of seconds.
- Avoid long and boring introductions. A drawn-out intro kills any interest in the video (even if it has a cool script and high-quality footage). Make the hook bright and interesting to increase this metric.
What metrics it can be combined with:
- Audience Retention + Average View Duration: When combined, these metrics help you understand when interest in a video begins to wane and what causes this phenomenon.
6. Audience Retention
What it is: Viewer attention retention schedule and key moments till which the video is viewed (hook, rewatches, etc.).
What the metric influences:
- Helps you find (un)suitable formats and problematic moments in videos. The lower the retention metric, the worse the video is for your channel. So you can remove anything that drags your statistics down.
- Increase the chance of scaling your content. The cleaner your statistics are, the higher the chance of your content appearing in trends.
How to increase the indicator:
- Make a teaser + a dynamic hook. The more dynamic and interesting the beginning, the more likely the viewer is to stay until the end.
- Cut out long pauses. The fewer unnecessary pauses and silences in your video, the easier it is for viewers to watch your video.
- Add chapters with subtitles. If the video is divided into parts, it will be easier for the viewer to immediately find what interests them.
What metrics it can be combined with:
- Re-watches + Audience Retention: Together, these metrics will help determine which videos are viewed most often and which moments in them make viewers do so.
- Playlists + Audience Retention: By combining these two metrics, you can understand which videos from which playlists attract more viewer attention.
7. Re-watches
What it is: Sections of videos that viewers rewind to watch again.
What the metric influences:
- Topics/actions and video formats that interest viewers. If a video is frequently rewatched, it means that the topic or format is interesting and should be filmed again.
How to increase the indicator:
- Create an intriguing teaser. A vivid recap of all the moments in the video helps to attract viewers’ attention not only the first time, but also when they watch it again.
- Use timecodes. It will be easier for viewers to rewatch your video if they can easily find the part that interests them and meets their needs.
- Highlight key moments with visual effects. To draw attention to a video and encourage people to watch it again, you need to fill it with interesting visual effects that make it easier to understand.
What metrics it can be combined with:
- Average View Duration (AVD) + Re-watches: The combination of these metrics helps to understand the pattern of viewing both a specific video and several videos in comparison.
- Average Percentage Viewed (APV) + Re-watches: In this case, both metrics help to collect statistics on what percentage of viewed videos viewers are willing to rewatch.
8. Engagement
What it is: How actively viewers interact with your videos.
What the metric influences:
- View/subscription/likes conversion. Each of these metrics is interconnected and shows how much viewers like your content and how often they interact with it (like, comment, share with friends).
- Audience loyalty. The higher the engagement with the video, the more favorable viewers are towards the creator, their advertising, and other initiatives.
- Forecast of future video views. If you understand your engagement metrics statistically, you can predict approximately how many likes and views you will receive. This can be important when discussing an advertising campaign.
How to increase the indicator:
- Add call-to-action. Remind viewers to subscribe, like/comment, and share with friends. People often forget to do this after watching.
- Give viewers questions and ask them to respond in the comments. Come up with an interesting question related to the video and ask viewers to share their opinions. This will increase your reach and audience loyalty.
- Offer something for subscription. This could be a checklist, an exclusive video, or anything else you can offer.
What metrics it can be combined with:
- Retention + Engagement: This combo is really helpful for understanding how viewers watch your content and interact with it at the same time.
- Average Percentage Viewed (APV) + Engagement: With these metrics, you can collect statistics on video views and the ratio of views to likes/comments.
9. Impressions Click-Through Rate
What it is: What is a good YouTube click through rate? The ratio of clicks on thumbnails/headlines to impressions in the recommendation feed.
What the metric influences: Time and number of views, as well as audience loyalty.
How to increase the indicator:
- Work on a catchy title and an interesting thumbnail. The cooler the picture, the more likely people are to click on your video and watch it.
- Test different styles and options. Make the text on the thumbnail noticeable and distinctive.
What metrics it can be combined with:
- Average View Duration (AVD) + CTR: After analyzing clicks on a video, you can understand how long viewers stay on the same video and analyze the reasons for failure.
- Traffic Sources + CTR: Along with audience statistics, you can immediately understand their behaviour during their first interaction with the video.
- Average Percentage Viewed (APV) + CTR: With the thumbnail click rate, it’s easier to collect stats on both individual videos and the content as a whole.
10. Playlist Engagement
What it is: The percentage of people who clicked on the playlist and watched videos from it. Any interaction with videos in playlist format (likes, comments) is also taken into account.
What the metric influences: The depth of content viewing and the duration of continuous presence on your channel.
How to increase the indicator:
- Create a meaningful name for your playlist. The title should reflect the essence of the playlist and all the videos in it.
- Include videos on only one topic. If the videos are on different topics with no common thread, viewers will quickly leave the channel.
- Create a powerful end screen with a reference to the next video in the playlist. If there is a final screen in each video, subscribers will watch more of your content at a time.
What metrics it can be combined with:
- Retention + Playlist Engagement: Helps you understand what percentage of viewer views go to a specific playlist.
- Views Per Unique Viewers + Playlist Engagement: This combination is ideal for determining what percentage of engagement goes to a specific playlist.
11. Unique Viewers
What it is: The number of unique users who watched your video or channel during a specific period of time.
What the metric influences:
- Increasing video reach. The more unique users watch your videos, the more actively your channel is promoted.
- Showing real statistics and engagement. Unique users show the real engagement of viewers with your videos and channel as a whole.
How to increase the indicator:
- Try new topics and video formats. The more combinations you try for your videos, the sooner you will find your approach and attract viewers.
- Do collaborations with different creators. Collaborative videos with other creators can bring you an influx of new subscribers to your channel.
What metrics it can be combined with:
- Traffic Sources + Unique Viewers: A combination of these metrics can help you understand the sources of unique visitor traffic and start working on scaling that traffic.
- Average Percentage Viewed + Unique Viewers: These two metrics combined make it possible to determine the percentage of unique users among all channel views.
12. Subscriber Growth
What it is: The growth trend of the number of subscribers and an indication of the moment when the Subscribe button was clicked.
What the metric influences:
- Stable income and views on the channel. The more active and frequent the growth in the number of subscribers, the more stable and enjoyable your channel’s income will be.
- Activity under videos. The more active your new subscribers are, the better it is for promoting your channel.
- Promotion of new content in recommendations. The better your subscribers engage with your past content, the more actively new videos will be promoted in recommendations.
How to increase the indicator:
- Create content regularly. If your content is published more than once a month, you have every chance of increasing your subscriber count.
- Analyze audience feedback. Comments are literally designed to help you understand why subscribers like or dislike your content. This will help you understand what to improve and why viewers might unsubscribe from your channel.
- Change strategy & test new ideas. The more often you test new ideas for videos, the more new subscribers you can attract. If you approach this idea without fanaticism, you can achieve success.
- Publish during peak hours. Want more new subscribers? Post videos when your subscribers are active. That way, your video will immediately rise to the top and signal to YouTube that it can be promoted to a new audience.
- Add call-to-action. If you want viewers to subscribe after watching, you need to occasionally remind them to do so in the video. This can be in the form of text on the video, a banner, or a mention by the creator between video segments.
What metrics it can be combined with:
Views + Subscriber Growth: You can estimate the percentage of people who watch videos without subscribing to the channel.
Retention + Subscriber Growth: In combination, you can see whether the viewer becomes a subscriber after a long stay on the channel.
CTA + Subscriber Growth: You can track how many people subscribed to the channel/liked it after the call to action.
13. Traffic Sources
What it is: Collecting information about where subscribers come from: Search, Browse/Home, Suggested, Shorts feed, External, Channel pages, Direct/Unknown, etc.
What the metric influences:
- SEO strategy. When you understand where your subscribers are coming from, you can optimize your channel to speed up the process.
- Content plan. By understanding the source of traffic, you can tailor your content so that even more people stumble upon it and subscribe to your channel.
- Understanding the channel’s pain points and steps to improve it. If you notice that a particular traffic source is not performing well, you can analyze the reasons and eliminate them.
What metrics it can be combined with:
- Retention + Traffic Sources: You can track how long audiences from different sources remain interested in your content.
- CTR + Traffic Sources: This combination allows you to understand how audiences from different sources behave with your video thumbnails.
14. Keywords
What it is: Words for search engine optimization of your content.
What the metric influences: Titles, video descriptions, topics for future content.
How to increase the indicator: Speaking about SEO tips for YouTube, update titles and timecodes to reflect changes in keywords. Keep an eye on Google Trends and your subscribers’ search queries.
What metrics it can be combined with:
- Average View Duration (AVD) + Keywords: Helps you understand how optimization affects the length of time your content is viewed.
- Average Percentage Viewed (APV) + Keywords: Allows you to compile statistics on changes in content viewership based on the use of SEO tools.
- CTR + Keywords: Once you know the keywords, you can add them to the title and thumbnails and analyze their contribution to the video’s success.
15. Most Popular Videos
What it is: Advanced analytics for the most popular videos on your channel.
What the metric influences:
- Creating a content plan based on strategies from popular videos. A successful video can help you plan a new video.
- Which formats and topics will generate a lot of views. Creating a content plan and selecting formats is made easier by the videos that have proven successful.
What metrics it can be combined with:
- Traffic Sources + Most Popular Videos: You can see where most viewers came from and what source made the video popular.
- Target Audience + Most Popular Videos: This combination helps to understand how much the target audience contributed to the increase in video views (or whether it was all down to recommendations and unique viewers).
YouTube Analytics Tools
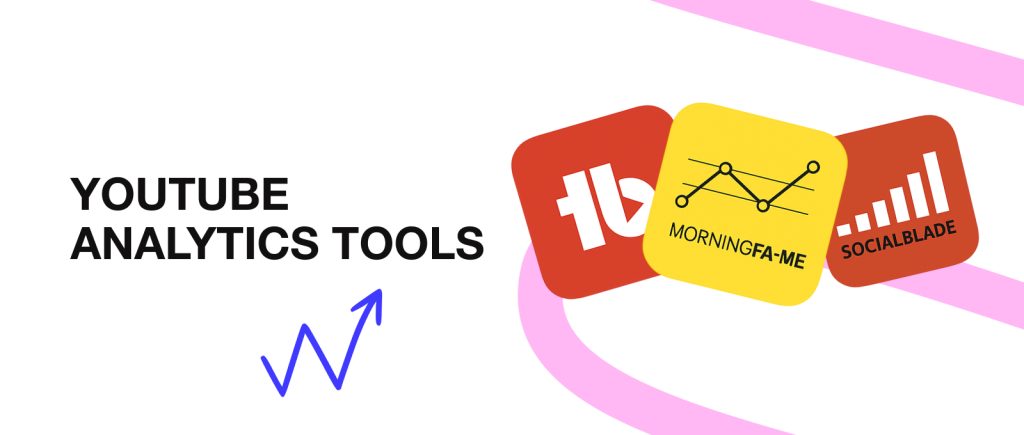
Above, we have listed literally all the important steps on how to audit a YouTube channel. We know, it looks very complicated, and you want to put it off indefinitely. Don’t rush to conclusions: we have compiled a list of the top tools that can greatly help facilitate the process of working with YouTube Analytics.
- TubeBuddy
A convenient tool for A/B analysis of CTR titles and thumbnails, forming ready-made channel promotion strategies, and testing hypotheses for content in numbers and accurate statistics.
- Social Blade
The tool supports all of the features listed above, but it has one special feature. It can estimate and predict the approximate revenue from each planned video, which sounds impressive. Plus, Social Blade is known for its thorough analysis of competitors and their advantages.
- Morningfame
Morningfame offers a very convenient comparative analysis of your videos across all key metrics. What’s more, for each video that isn’t performing well, the tool provides a personalized SEO guide with steps for optimization.
- vidIQ
A tool that quickly identifies the most successful videos and analyzes all possible reasons why videos become trending. VidIQ also offers convenient cards with metrics and analytics directly in the Shorts feed.
- Viewstats
In addition to testing thumbnails, titles, and video descriptions, the tool provides analytics on typical viewing time and duration, and evaluates the reasons for video ‘turn-offs.’ If you are still searching for services for YouTube creators, we recommend considering this excellent option.
Advanced Approach to YouTube Analytics
Want to get the most out of YouTube Analytics? It’s possible! Here are a couple of options for further optimizing your channel.
- Using Advanced Mode for Deep Analysis
Didn’t know that Analytics had a pro version? Don’t worry, we’ll tell you all about it now. With Advanced Mode, you can get metrics in the form of tables for different periods, comparing each one at the same moment. Video group analysis (playlists, most popular by views, etc.) is also available for a better understanding of how the algorithms work. How do you turn on the Advanced Mode? Here’s a detailed guide from YouTube.
- Data Export and Processing in Google Sheets or BI-tools.
In addition to using the tools above, you can literally export metrics and let the platforms do the analysis. For example, export from Advanced Mode to CSV/Google Sheets for one-off reports or Looker Studio, which can offer collaborative content analysis with your team. This process can be further automated with API/Apps Script, where data is exported automatically on a schedule.
- Keep an Eye on Trends and Algorithm Changes
Many YouTube analysts emphasize that it is critically important to constantly follow the news about the video hosting service, because everything changes very quickly. For example, Trends was removed and a separate tab for Shorts appeared, which significantly affected the algorithms and changed the game. In reality, changes on YouTube are not so scary if you are aware of what is happening and know how to respond quickly to innovations.
- Schedule A Regular Review Of Analytics
All our advice about YouTube Analytics will be meaningless if you only do this a few times. Our advice is quite simple: make a schedule for how often you will check your metrics in YouTube Analytics. At first, this could be weekly, then monthly, and so on. Just be sure to always examine your channel’s metrics so that you can change your content plan in a timely manner and manage the situation as a whole.
Final Thoughts
Although we have looked at a large number of metrics, it is important to focus on the main idea: the creator’s constant work with YouTube Analytics metrics is literally the secret key to ‘hacking’ your channel and quickly promoting it among competitors.
Of course, we know that you won’t be able to analyze 15+ metrics at once, so focus on 2-3 at first and scale your Analytics analysis daily. If you are patient and put effort into this process, you will soon be Googling not Analytics metrics, but creator payment services to withdraw your first serious earnings from YouTube.